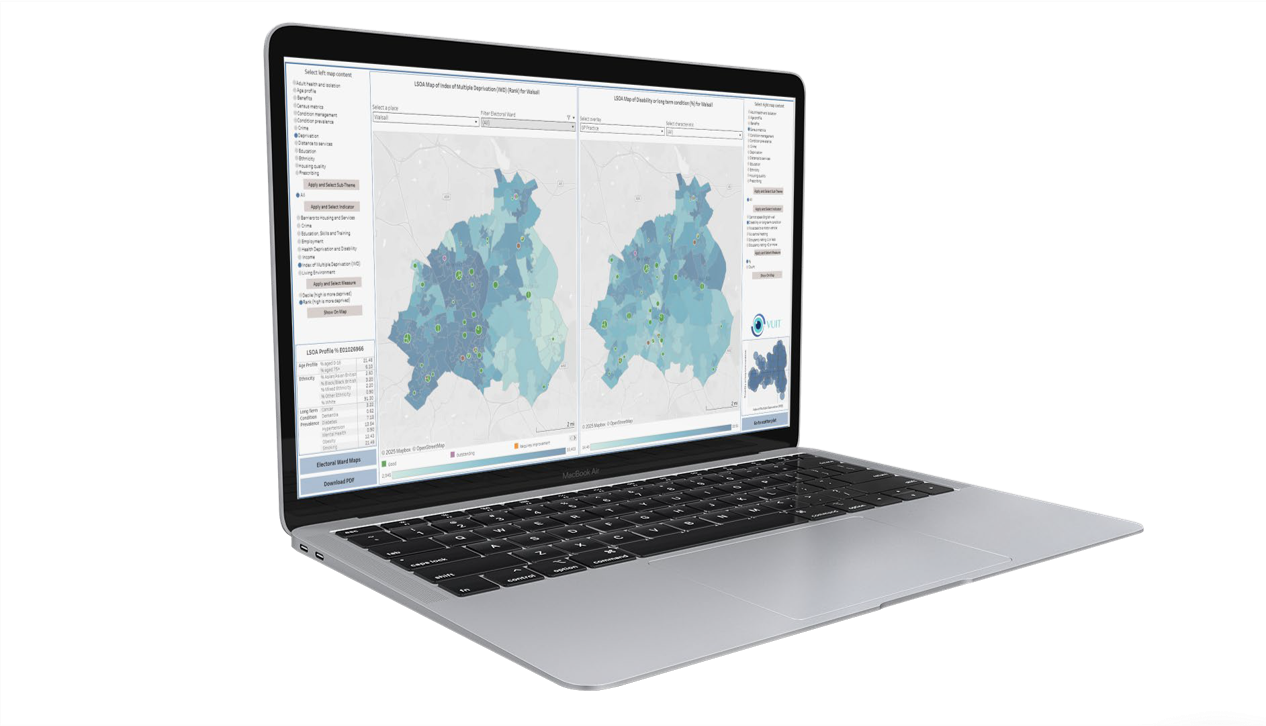
VUIT redefines what we can understand about people and the communities they live in.
.png)
We then make this deeper understanding available to those responsible for delivering improved health outcomes for the UK population.
This equips them with the insights they need to meet each community’s specific care needs, now and in the future.
We work across a huge range of data sets, providing value to many settings, including:
 Primary Care
 Acute Care
 Social Care (Local Authorities)
 Mental Health
 Community Care
 Housing Associations
 Place Based Care
 Integrated Care
 Central Government (NHSE & DHSC)
 Charities
 Universities
 Pharma & Life Sciences
VUIT has the most complete set of NHS provider benchmarking visualisations anywhere in England.


How does it help the user?
We overlay all relevant information from a variety of publicly available sources to build a hugely detailed, incredibly accurate picture of our nations neighbourhoods and citizens. Our uniquely informative resource:

 Collated from over 150 separate data sets
 Presented in a uniquely accessible, visual format
 Covers both wide-angle and close-up perspectives
 Highlights links, correlations and relevant connections
 Reveals trends and patterns previously hidden
 Illuminates whole people, not just patients
 Enriches our understanding of underlying causes
